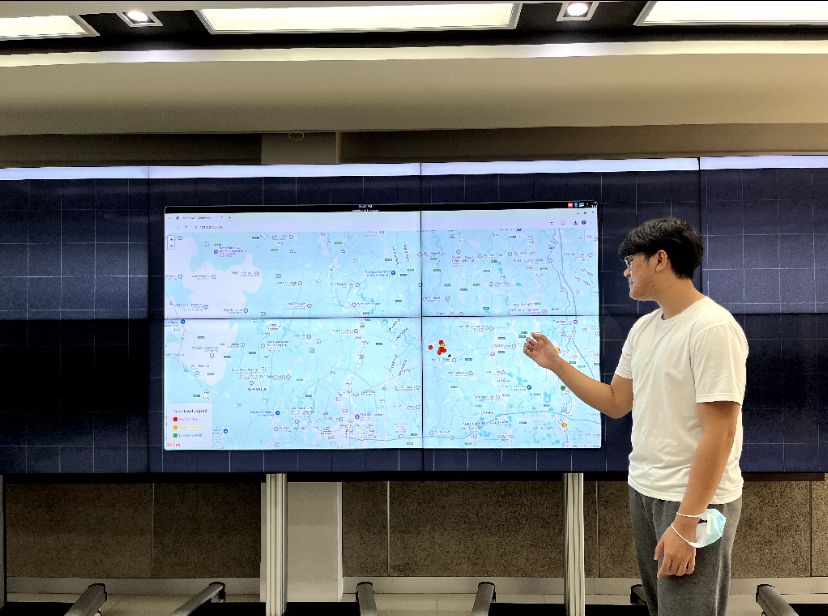
Noise map
Noise contour maps are created utilizing time series sound pressure level data and a suitable interpolation equation superimposed on the maps. Sound level contour maps are created using sound pressure level data that varies over time.
As a result, visualizing sound levels in various scenarios on a map is challenging and necessitates handling a lot of data that is computed using mathematical functions along with their geographic coordinates. A tool for creating a general noise map that can be used for other ecological or environmental research projects by displaying sound levels on digital maps that receive measured or forecasted data from several sources.
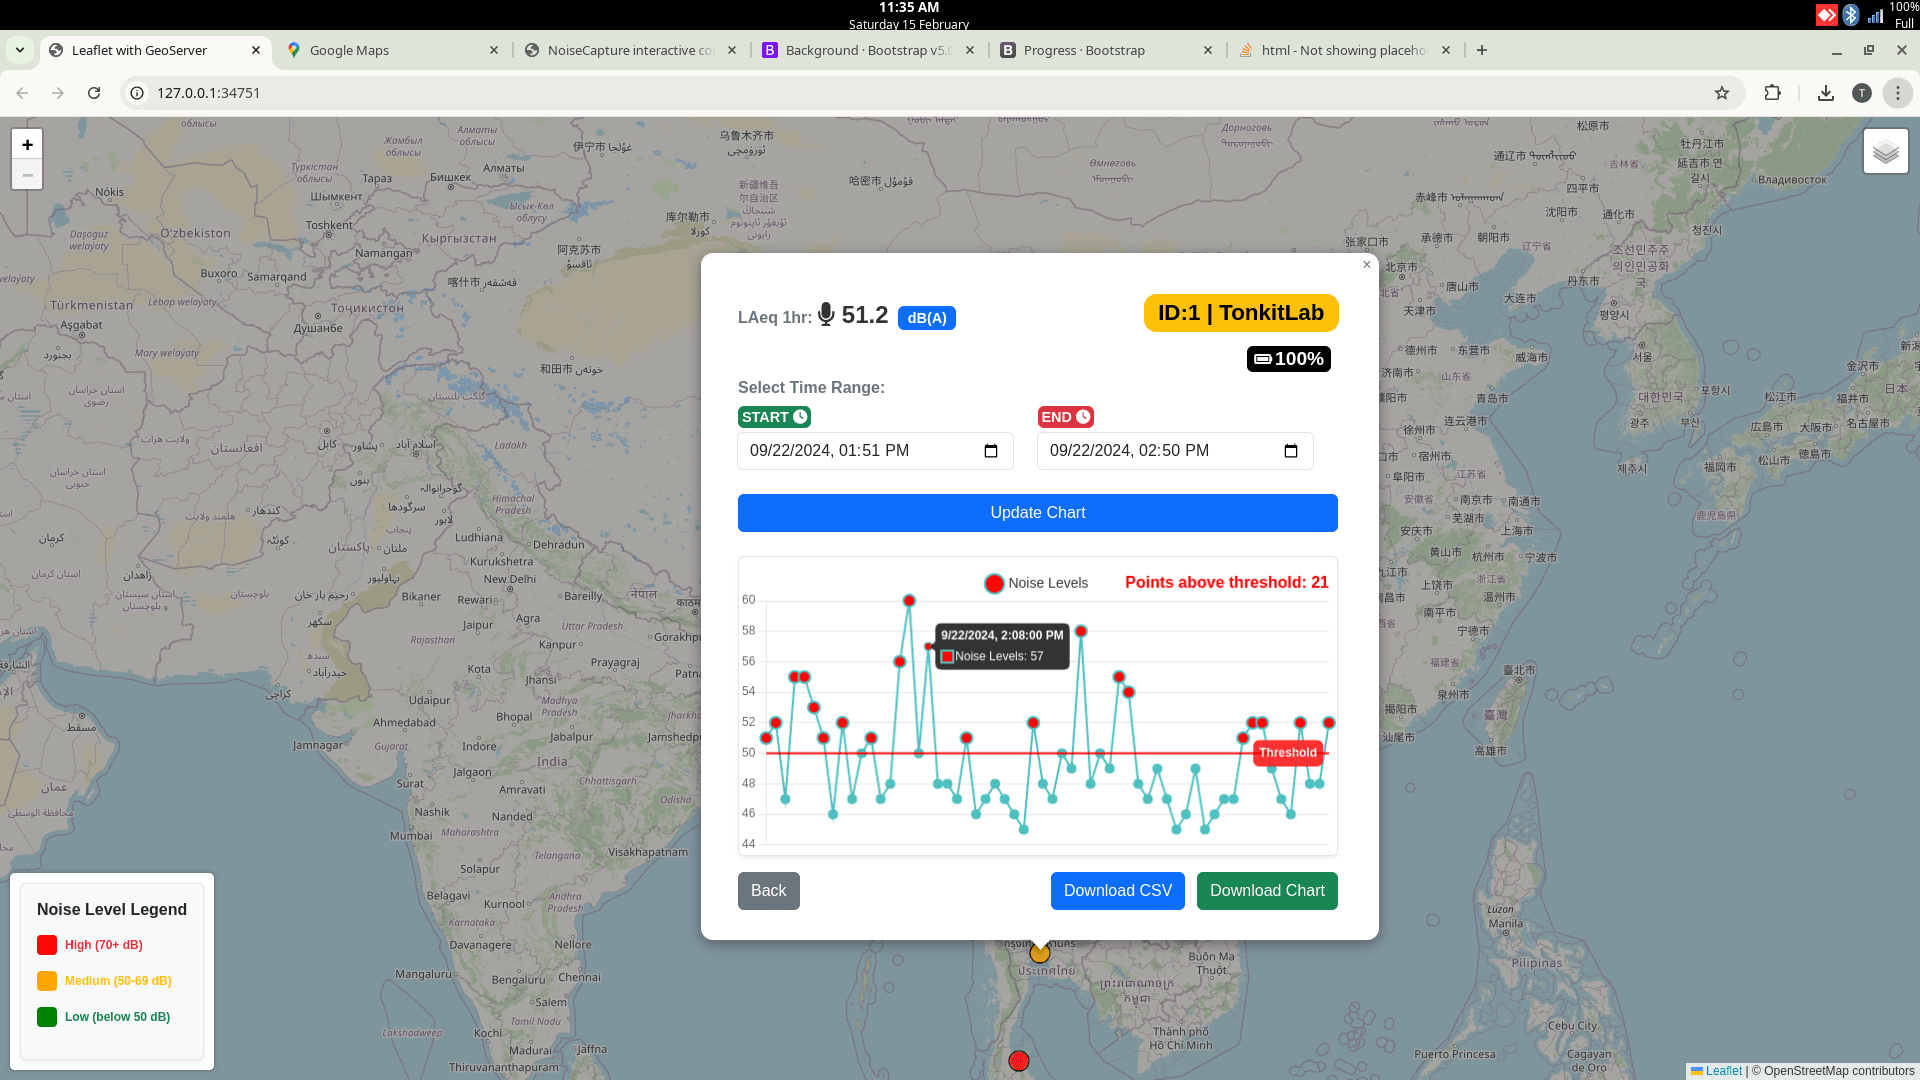
- Noise map platform can receive sound levels data from many devices
- data tools Geoserver
- Database postgreSQL
- Mapping tools on Leaftlet
A platform that can receive data from many devices and visualize it on a shared map on Leaflet can also be developed using a number of tools. Those who are interested in becoming a part of the continuing research team can also apply for the project.